Hillshaded Color Relief Map Using Drone Images
This document walks you how to create a hillshaded, color relief map that shows elevation and feature details of your land using drone captured images. This builds on the drone map doc and assumes you've already captured the requisite images.
Generate DSM
The first step is to generate the Digital Surface Model using OpenDroneMap. We can do this with the same tool we used to stitch the orthomosaic, we just need to tweak the parameters slightly by adding the --dsm flag. You can also add the --dtm flag to create a Digital Terrain Model. The DSM shows all features while the DTM attempts to remove buildings and other objects. I prefer the look of the DSM.
As a reminder, we've set SCRATCH_DIR to the working directory containing our images/ folder.
SCRATCH_DIR=~/scratch
docker run -ti --rm -v $SCRATCH_DIR:/datasets/code opendronemap/odm \
  --project-path /datasets --max-concurrency $CONCURRENCY --dsm
You'll find the results in SCRATCH_DIR/odem_dem once the command has finished. If you open dsm.tif you'll notice it doesn't look like much, it's all white. That's because the file encodes elevation data and not color.
The tool gdalinfo is useful for working with GeoTIFF files and I've used it when debugging GIS workflows. We can use it to inspect a file with the following command.
docker run -ti --rm -v $SCRATCH_DIR:/datasets/code ghcr.io/osgeo/gdal:alpine-normal-latest \
  gdalinfo /datasets/code/odm_dem/dsm.tif
At the end of the result you'll see information about the photo bands.
Band 1 Block=512x512 Type=Float32, ColorInterp=Gray
  Min=269.860 Max=316.080
  Minimum=269.860, Maximum=316.080, Mean=292.287, StdDev=7.192
  NoData Value=-9999
  Metadata:
    STATISTICS_MAXIMUM=316.07998657227
    STATISTICS_MEAN=292.28659115106
    STATISTICS_MINIMUM=269.85998535156
    STATISTICS_STDDEV=7.1919758531144
    STATISTICS_VALID_PERCENT=77.71
The DSM file has only a single band that represents elevation. The min/max are the range of the photo elevation in meters. Keep this in mind as this may come in handy while styling the color relief map.
Create Hillshade Map

The first step is to create the texture map using the GDAL's hillshade tool. There are a lot options for rendering the hillshade map, such as exaggerating the height and changing the light source, but I find the defaults work well.
Let's create a temporary directory and then use gdaldem to create the hillshade map.
mkdir $SCRATCH_DIR/tmp
docker run -ti --rm -v $SCRATCH_DIR:/datasets/code ghcr.io/osgeo/gdal:alpine-normal-latest \
  gdaldem hillshade /datasets/code/odm_dem/dsm.tif /datasets/code/tmp/hillshade.tif
Create Color Relief Map
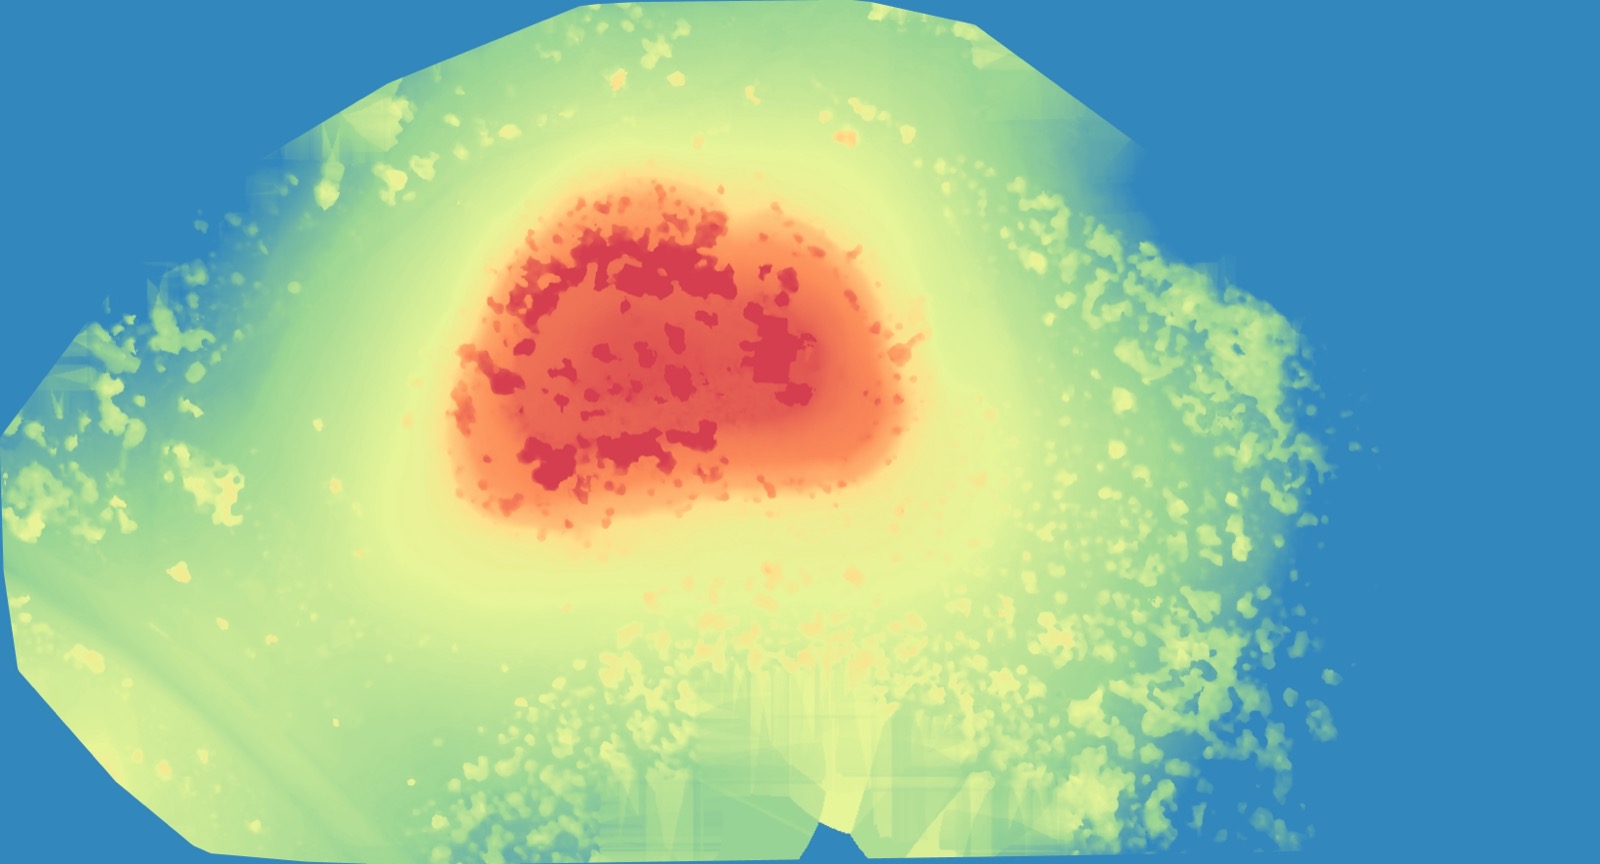
Next we'll create the color relief map. While the defaults work well for hillshading, for color relief we are forced to make some creative choices. The tool requires a color gradient for the relief map. This gradient is defined in a file with the following format.
E R G B
E R G B
E R G B
Where E is the elevation, either absolute or as a percentage of the map's elevation range, and RGB are the color values (in the range of 0-255). You can use an online tool like colorbrewer2 or viridis palette generator to create a sensible color gradient for you, or you if you're feeling artistic you can create your own. I think the six color spectral gradient is a good default.
0% 50 136 189
20% 153 213 148
40% 230 245 152
60% 254 224 139
80% 252 141 89
100% 213 62 79
Or if you are using absolute elevation (informed by the numbers from gdalinfo above) you would make a file like this.
285 50 136 189
290 153 213 148
295 230 245 152
300 254 224 139
305 252 141 89
310 213 62 79
Once you've selected your pallette write the color gradient to a file and then create the color relief map.
echo "0% 50 136 189
20% 153 213 148
40% 230 245 152
60% 254 224 139
80% 252 141 89
100% 213 62 79" > $SCRATCH_DIR/colors.txt

docker run -ti --rm -v $SCRATCH_DIR:/datasets/code ghcr.io/osgeo/gdal:alpine-normal-latest \
  gdaldem color-relief /datasets/code/odm_dem/dsm.tif /datasets/code/colors.txt /datasets/code/tmp/relief.tif
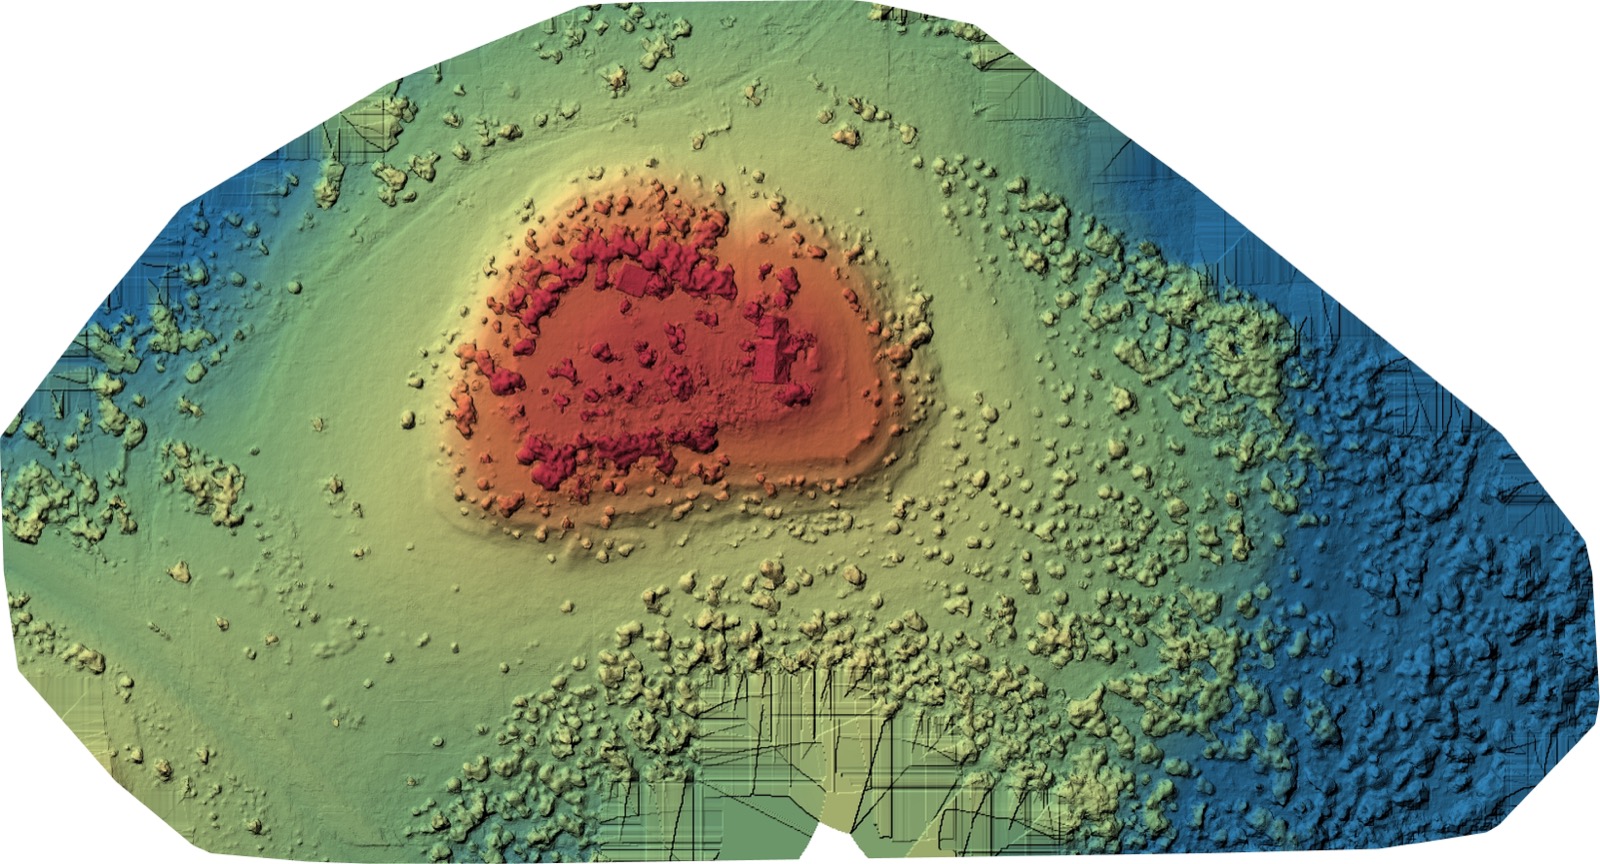
Combine Hillshade and Color Relief
Finally you'll want to combine the two images into a single result. This command scales the color relief pixels by the corresponding pixel in the hillshade map.
docker run -ti --rm -v $SCRATCH_DIR:/datasets/code ghcr.io/osgeo/gdal:alpine-normal-latest \
  gdal_calc.py -A /datasets/code/tmp/hillshade.tif --A_band 1 \
  -B /datasets/code/tmp/relief.tif  --B_band 1 \
  -C /datasets/code/tmp/relief.tif  --C_band 2 \
  -D /datasets/code/tmp/relief.tif  --D_band 3 \
  --outfile=/datasets/code/hillshade_relief.tif \
  --calc="B*(A/255)" --calc="C*(A/255)" --calc="D*(A/255)"
This command runs per-pixel math on the two images to create the final result. You have to import each band individually. The hillscale map is greyscale but the color relief map is RGB so you'll have to import each of its three bands separately.
The result usually looks decent with these default settings, but I recommend playing around with the gradient to find one that suits your property. In our case the Montanoso color scheme was chosen to match the website and also roughly match the terrain and vegetation of the actual property.